Top 6 Tools for SQL Database Monitoring
SQL database monitoring is critical for maintaining performance, avoiding downtime, and ensuring compliance. Here are six tools designed to meet different needs, from startups to enterprises:
- newdb.io Monitoring Suite: Optimized for modern apps with SQLite compatibility, global distribution, and flexible pricing.
- SQL Server Management Studio (SSMS): Built-in tool for SQL Server users offering free, essential monitoring features.
- SolarWinds Database Performance Analyzer (DPA): Advanced analytics and cross-platform support for enterprise environments.
- ManageEngine Applications Manager: Tracks both database and IT infrastructure performance, ideal for diverse setups.
- Idera SQL Diagnostic Manager: Focused on SQL Server, offering deep insights and predictive alerting.
- Quest Foglight for Databases: Comprehensive monitoring for multi-database environments, including cloud platforms.
Each tool caters to specific use cases, budgets, and technical requirements, ensuring businesses can find the right fit for their database monitoring needs.
Quick Comparison
| Tool | Key Features | Supported Platforms | Pricing (USD) | Best Use Cases | Limitations |
|---|---|---|---|---|---|
| newdb.io Monitoring Suite | Real-time tracking, global distribution | SQLite-compatible databases | Free & scalable plans | Startups, modern app development | Limited to SQLite-compatible databases |
| SSMS | Built-in monitoring, query insights | SQL Server | Free (with SQL Server) | Cost-conscious teams using SQL Server | SQL Server exclusive |
| SolarWinds DPA | Advanced analytics, anomaly detection | SQL Server, Oracle, MySQL, PostgreSQL | From $1,275 annually | Enterprises needing cross-platform support | Higher cost |
| ManageEngine Apps Manager | IT and database monitoring, customizable | SQL Server, Oracle, MySQL, PostgreSQL | From $715 annually | IT teams managing diverse setups | Steep learning curve |
| Idera SQL Diagnostic Mgr | SQL Server optimization, predictive alerts | SQL Server, Azure SQL | From $1,995 annually | SQL Server-heavy environments | SQL Server only |
| Quest Foglight | Multi-database, cloud support | Oracle, SQL Server, MySQL, PostgreSQL | Contact vendor | Large enterprises, multi-database setups | Enterprise pricing |
Takeaway
Selecting the right tool depends on your database type, budget, and operational needs. For SQL Server-specific monitoring, SSMS or Idera are great options. If you need cross-platform capabilities, SolarWinds DPA or Quest Foglight may be better suited. For startups or modern app developers, newdb.io offers a cost-effective, lightweight solution.
Database Monitoring Tools
1. newdb.io Monitoring Suite
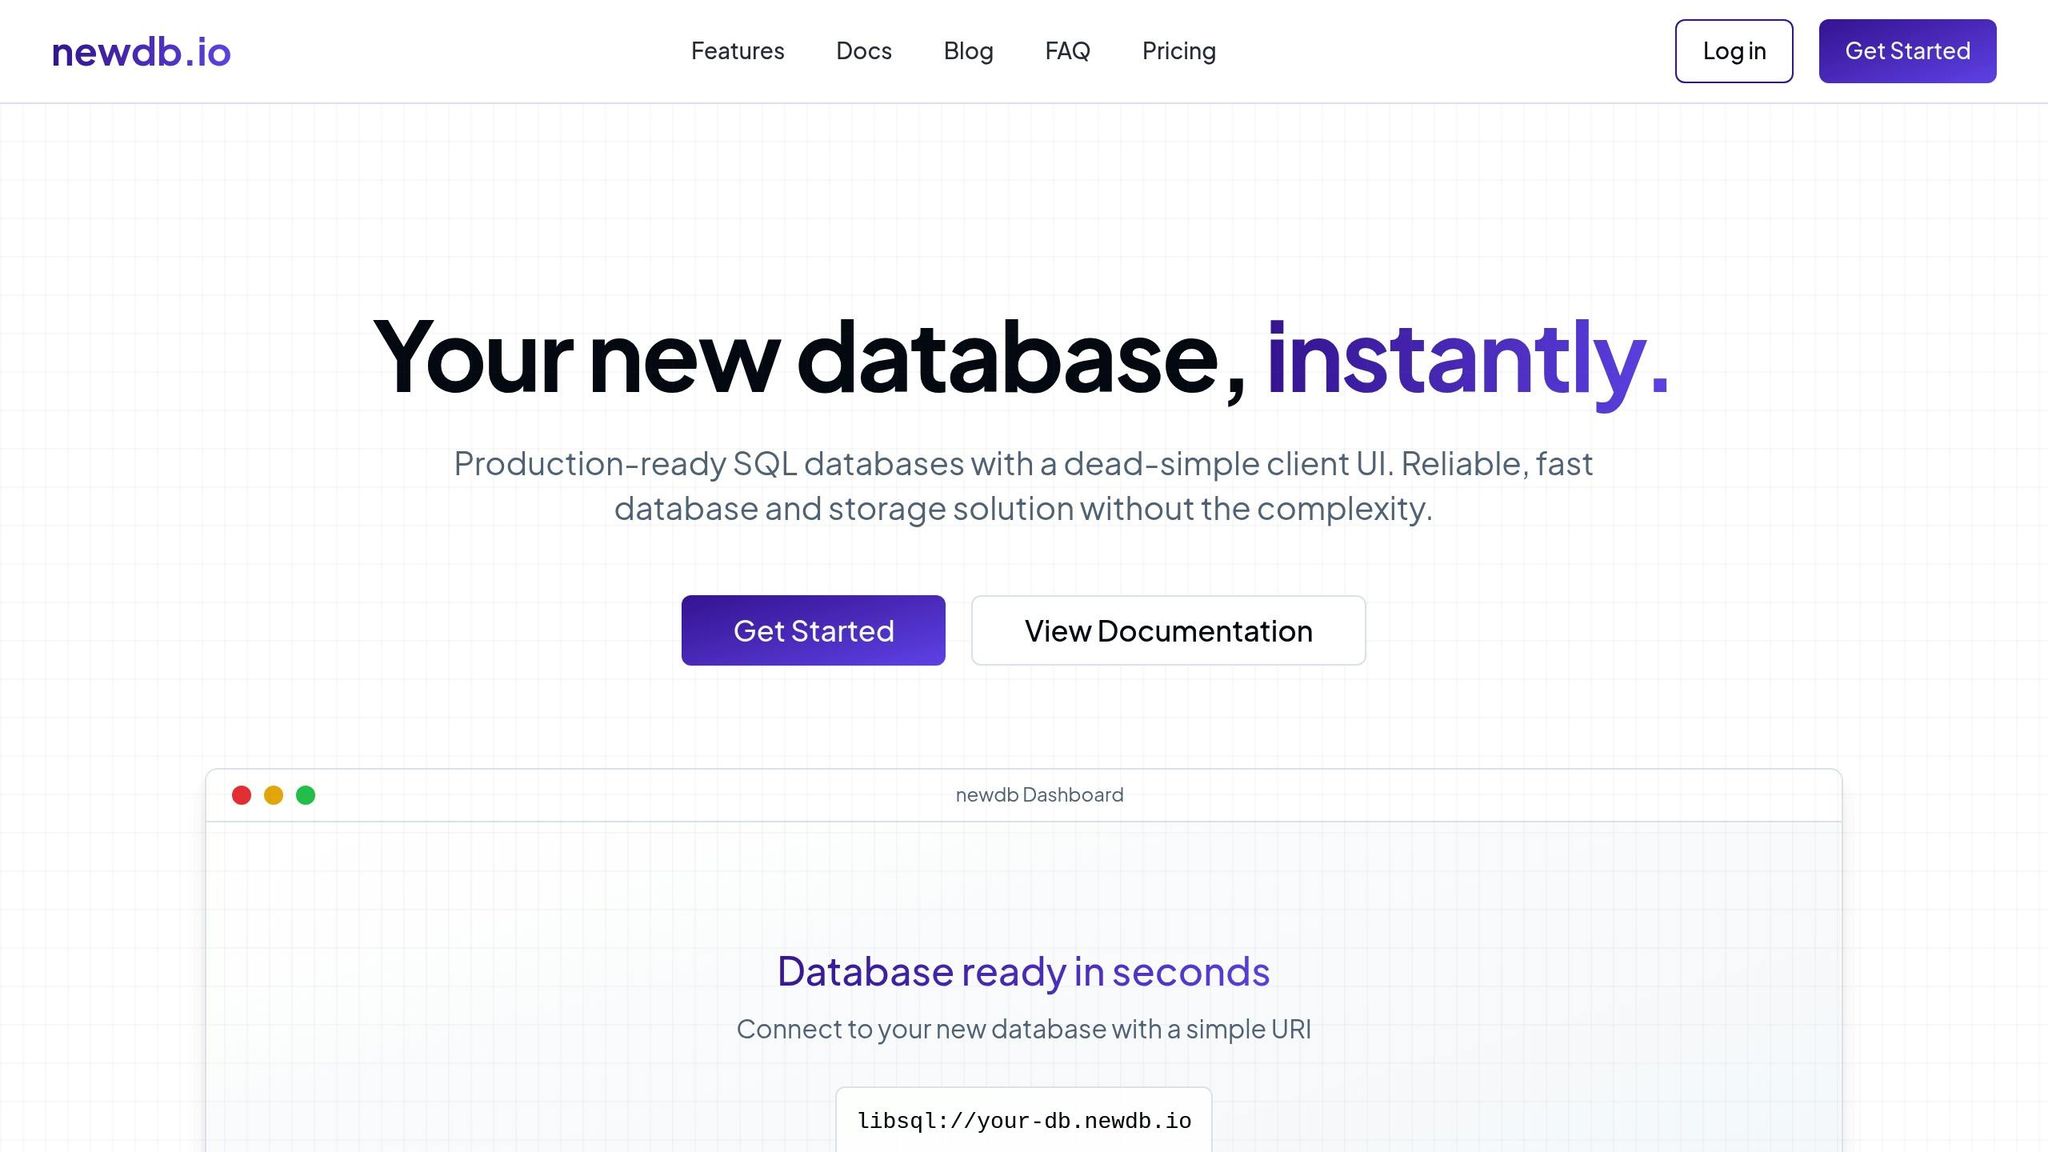
newdb.io provides production-ready SQL databases powered by libSQL and Turso. It features an easy-to-use client interface, quick setup, and global distribution, making it a solid choice for modern data operations.
Real-time Performance Monitoring
With real-time performance monitoring, newdb.io delivers instant insights through a user-friendly interface. You’ll get access to low-latency performance metrics and fast instance provisioning, ensuring smooth and efficient data management on a global scale.
Global Distribution and Easy Migration
newdb.io simplifies data migration by supporting multiple formats, including SQL, CSV, JSON, and XLSX. It also integrates effortlessly with popular ORMs like Prisma, allowing developers to maintain their workflows without interruptions.
Flexible Plans and Pricing (USD)
To meet diverse business needs, newdb.io offers scalable pricing options:
- Free Plan: Covers essential features.
- Pro Plan: Includes advanced monitoring tools and additional support.
- Enterprise Plan: Offers custom solutions, such as automatic backups and a visual data editor.
These options make it easy to find a plan that aligns with your organization’s goals and budget.
2. SQL Server Management Studio (SSMS) Activity Monitor & Extended Events
For organizations using Microsoft SQL Server, SQL Server Management Studio (SSMS) provides built-in monitoring tools that work well alongside more advanced platforms like newdb.io. As Microsoft's go-to database administration tool, SSMS comes bundled with SQL Server installations and offers features designed to help administrators manage and monitor SQL Server environments effectively.
Real-time Performance Monitoring
SSMS's Activity Monitor delivers up-to-the-minute insights into database performance. It offers an auto-refreshing dashboard that tracks processes, wait statistics, file I/O, and resource-heavy queries. These wait stats are particularly helpful in identifying whether performance issues are tied to CPU limitations, memory constraints, or I/O bottlenecks. Administrators can dig deeper into specific wait types to better understand and address system behavior.
Another key feature, Extended Events, provides a more advanced approach to performance monitoring. It captures detailed diagnostic data while keeping system overhead low, a significant improvement over older profiling tools. This capability enables administrators to gather precise insights and troubleshoot issues more effectively, complementing the real-time data offered by Activity Monitor.
Alerting and Diagnostics Features
SSMS doesn't just provide performance data - it also helps administrators stay ahead of potential problems. Through Activity Monitor, it can identify blocking processes, highlighting sessions that might be preventing other queries from running. The tool even visualizes blocking chains, making it easier to pinpoint the root causes of slowdowns during busy periods.
Extended Events takes diagnostics further by offering both predefined and customizable sessions to monitor specific conditions like failed login attempts, deadlocks, or slow-running queries. The always-on system_health session, which runs automatically on all SQL Server instances, collects critical data such as deadlock graphs and memory pressure indicators.
Additionally, SSMS integrates with Query Store, which tracks the execution history of queries. This feature is invaluable for spotting performance regressions and tracking plan changes over time. If a query's performance deteriorates, administrators can easily revert to a previous execution plan to restore efficiency.
Scalability and Cost Considerations
One of SSMS's major advantages is that it's included at no extra cost with SQL Server licenses. This makes it a budget-friendly option for organizations already invested in Microsoft's ecosystem. Whether you're managing a small development setup or a large enterprise environment with hundreds of databases, SSMS scales to meet your needs.
That said, SSMS's monitoring capabilities are limited to managing a single SQL Server instance at a time. For those handling multiple instances, separate connections are required. Even so, because these features are part of the core SQL Server licensing - available in both Standard and Enterprise editions - organizations can utilize SSMS's monitoring tools without additional expenses.
3. Database Performance Analyzer (DPA) by SolarWinds
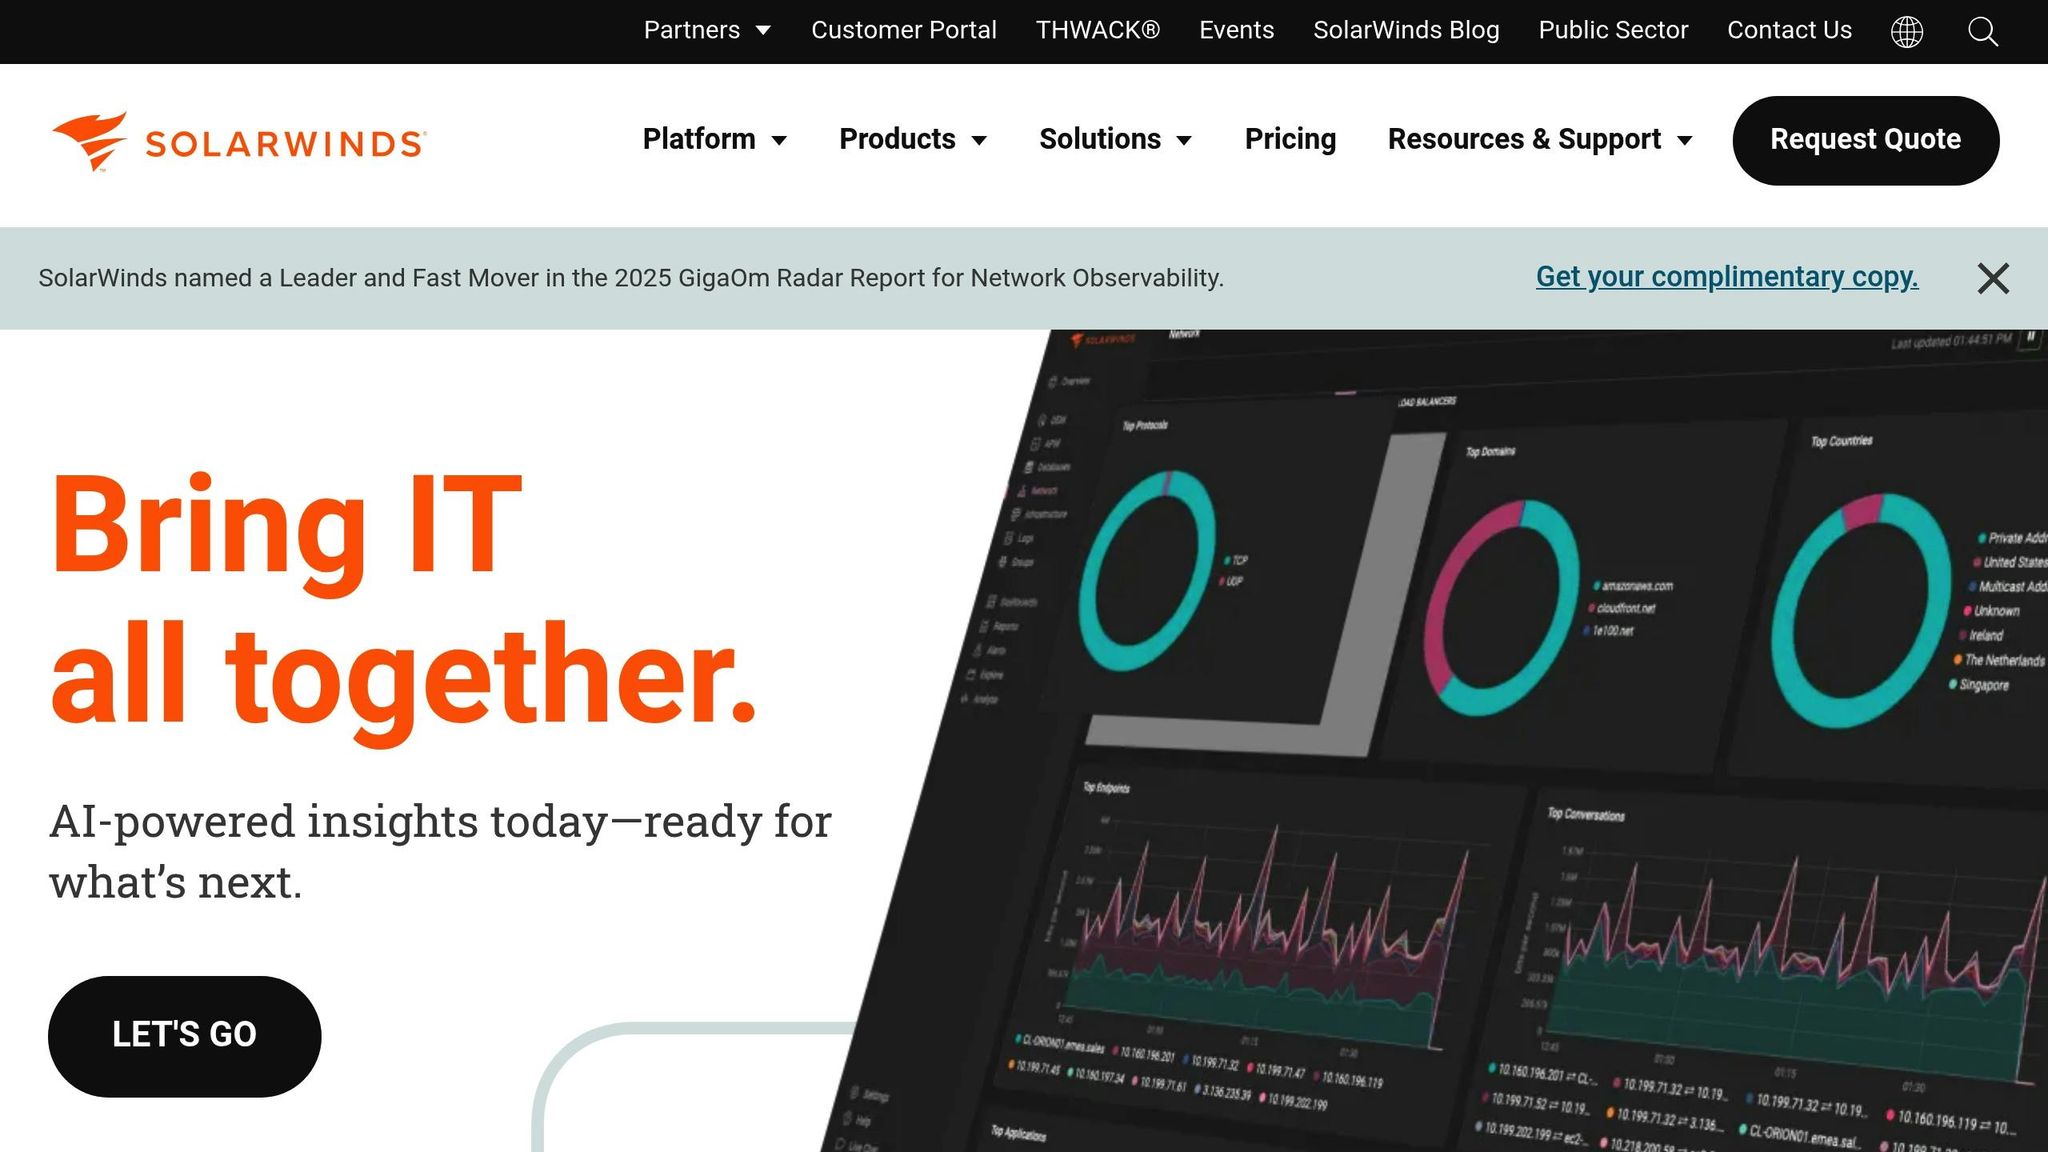
SolarWinds Database Performance Analyzer (DPA) offers a powerful combination of advanced analytics and real-time monitoring to identify and resolve performance bottlenecks across various SQL platforms. By pairing live data with historical trends, DPA provides a well-rounded view of database health, ensuring optimal performance and reliability.
Real-time Performance Monitoring
DPA goes beyond basic monitoring by providing detailed wait time analysis. It categorizes delays into areas like I/O, lock, and network waits, giving administrators a clear picture of what’s causing slowdowns - whether it’s disk performance issues, blocking queries, or other specific factors.
The platform also employs pattern detection to spot unusual database behavior. By flagging anomalies and linking them to changes in execution plans, especially during application updates or maintenance, DPA helps prevent potential issues before they escalate.
Alerting and Diagnostics Features
DPA uses adaptive thresholds based on historical performance trends to deliver smarter alerts. These alerts come with diagnostic details, highlighting problematic queries and offering actionable recommendations. For instance, if a database typically handles heavier traffic during business hours, DPA adjusts its thresholds to avoid unnecessary alerts during high-activity periods.
Its root cause analysis digs deep into storage, network, and application layers, helping administrators zero in on the primary source of an issue instead of chasing surface-level symptoms.
Cross-platform and Cloud Compatibility
Designed with flexibility in mind, DPA supports a wide range of database platforms, including SQL Server, Oracle, MySQL, PostgreSQL, and Amazon RDS. It seamlessly monitors mixed and cloud-based environments like Amazon RDS, Azure SQL, and Google Cloud SQL, tailoring insights to each provider’s unique metrics.
DPA’s integration capabilities enhance its utility even further. It connects with popular IT service management tools like ServiceNow and Jira, enabling automatic ticket creation from database alerts. When paired with other SolarWinds monitoring solutions, DPA provides a unified view of application and infrastructure performance.
Scalability and Pricing Options
Whether you’re managing a small setup or a large enterprise, DPA’s scalable design fits a variety of needs. Its pricing is based on a per-database instance model, with options available for distributed architectures to accommodate growing demands.
4. ManageEngine Applications Manager
ManageEngine Applications Manager offers a way to monitor SQL database performance while keeping an eye on the overall IT infrastructure. This allows administrators to see how database issues tie into the broader health of applications, making it more than just a database monitoring tool. By blending database metrics with system-wide insights, it helps pinpoint how database problems ripple through the entire system. Here’s how it stands out.
Real-time Performance Monitoring
Applications Manager provides continuous, real-time insights into SQL metrics through customizable dashboards. It tracks key indicators like connection pool usage, query execution times, cache hit ratios, transaction log growth, and slow queries. It also monitors related metrics such as CPU, I/O, and memory usage, while linking these to server-level performance metrics like CPU, memory, and disk utilization.
This holistic view helps administrators figure out whether issues are tied to database configurations or hardware limitations, bridging the gap between database performance and the underlying infrastructure.
Alerting and Diagnostics Features
The platform offers customizable alerts for critical events like deadlocks, backup failures, failed logins, and high tablespace usage. With built-in root cause analysis, it connects database slowdowns to specific applications and users, helping teams quickly identify the impact. Automated health checks also review configurations, index usage, and maintenance tasks, helping prevent potential problems before they escalate.
These tools ensure that administrators can prioritize fixes based on which applications or users are most affected by performance drops.
Cross-platform and Cloud Compatibility
Applications Manager works with a wide range of databases, including SQL Server, Oracle, MySQL, PostgreSQL, and IBM DB2. It also supports cloud-based databases like Amazon RDS, Azure SQL Database, and Google Cloud SQL. It captures key metrics such as read/write IOPS, storage usage, and connection throttling.
The platform integrates with ServiceDesk Plus to automatically create tickets when issues arise. Additionally, it connects with other ManageEngine tools to provide a unified view of the IT infrastructure.
Scalability and Pricing Options
The licensing model is flexible, starting at around $395 per year for 10 monitors. Designed for scalability, its distributed monitoring setup supports high availability, failover, and load balancing, making it capable of monitoring thousands of instances with sub-second alerting.
5. Idera SQL Diagnostic Manager
Idera SQL Diagnostic Manager is built specifically for SQL Server environments, delivering advanced monitoring and historical analysis to keep databases running smoothly. It focuses on SQL-specific metrics and provides actionable recommendations to optimize database performance.
Real-time Performance Monitoring
The Performance Analysis Dashboard keeps tabs on over 600 SQL Server metrics, such as wait statistics, blocking processes, tempdb usage, and plan cache efficiency. These insights help pinpoint inefficiencies before they disrupt users. Additionally, it offers detailed views of query execution plans, making it easier to identify and address poorly performing queries early on.
With Custom Counters, administrators can track metrics tailored to their business needs alongside standard SQL metrics. For example, you can monitor application-specific data like order processing times or user session counts and link these to database performance trends.
Alerting and Diagnostics Features
The tool’s Predictive Alerting uses historical baselines to flag deviations from normal performance patterns. Its Alert Response feature can automatically run scripts or stored procedures when certain triggers occur, streamlining the resolution of recurring issues.
Key diagnostic features include a Query Monitor to track resource-intensive queries and a Deadlock Monitor that captures detailed deadlock graphs. These tools are essential for resolving concurrency problems quickly and ensuring databases scale efficiently while staying cost-effective.
Cross-platform and Cloud Compatibility
Although primarily designed for SQL Server on-premises, SQL Diagnostic Manager also supports SQL Server instances on AWS EC2 and Azure Virtual Machines. It can monitor multiple versions of SQL Server, from SQL Server 2008 to the latest releases, making it a versatile choice for mixed environments during upgrades.
The tool integrates seamlessly with Active Directory for authentication, supports SNMP for network monitoring, and offers REST APIs for custom integrations. It even allows exporting data to external systems for compliance or reporting needs.
Scalability and Pricing Options
Licenses are priced per SQL Server instance, starting at around $1,995 annually. The Enterprise Edition, which includes predictive analytics and custom dashboards, is available for about $2,995 per instance. Its distributed architecture is capable of monitoring thousands of instances, with configurable data retention for up to two years, making it a scalable solution for large organizations.
sbb-itb-687e821
6. Quest Foglight for Databases
Quest Foglight for Databases brings together SQL monitoring with real-time tracking and advanced analytics, helping ensure your database operates at peak performance.
Real-time Performance Monitoring
With Foglight, you get continuous tracking of critical metrics like CPU usage, memory, I/O, and connection counts - all displayed on customizable dashboards. It dives deep into SQL workloads, identifying resource-heavy queries and analyzing wait times to uncover bottlenecks. This real-time monitoring works hand-in-hand with Foglight's sophisticated alerting system.
Alerting and Diagnostics Features
Foglight's adaptive alerting minimizes false alarms and escalates serious issues through email, SNMP, or ticketing system integrations. Its diagnostic tools go a step further by correlating performance metrics, such as query plans, system statistics, and resource usage. It also tracks schema and configuration changes, making it easier to pinpoint and resolve problems quickly.
Cross-platform and Cloud Compatibility
Whether you're managing Oracle, SQL Server, MySQL, PostgreSQL, or DB2, Foglight keeps everything under one roof. It supports physical, virtual, and cloud setups, including Amazon RDS, Azure SQL, and Google Cloud SQL. With both agent-based and agentless options, it integrates seamlessly using REST APIs, PowerShell, and LDAP. Plus, it allows you to export performance data for detailed reporting.
Tool Comparison Chart
Keeping track of SQL performance is essential in today’s fast-moving database environments. The chart below breaks down six top SQL monitoring tools by features, platform support, pricing, use cases, and limitations, helping you find the best fit for your needs.
| Tool | Key Features | Supported Platforms | Pricing (USD) | Best Use Cases | Limitations |
|---|---|---|---|---|---|
| newdb.io Monitoring Suite | Real-time performance tracking, instant database creation, global distribution, automatic backups, visual data editor | libSQL, Turso, SQLite-compatible databases | Free and scalable pricing | MVPs, prototypes, internal tools, rapid development projects | Limited to SQLite-compatible databases, newer platform with evolving feature set |
| SQL Server Management Studio Activity Monitor & Extended Events | Built-in monitoring, query execution plans, wait statistics, resource usage tracking | SQL Server only | Free (included with SQL Server) | SQL Server environments, cost-conscious organizations, basic monitoring needs | SQL Server exclusive, limited advanced analytics, no cross-platform support |
| Database Performance Analyzer (DPA) by SolarWinds | Machine learning anomaly detection, historical trend analysis, query tuning advisor, cross-platform support | SQL Server, Oracle, MySQL, PostgreSQL, DB2, SAP ASE, Amazon RDS | Starting at $1,275 per monitored database instance annually | Enterprise environments, multi-database platforms, organizations requiring advanced analytics | Higher cost, complex setup, may be overkill for smaller deployments |
| ManageEngine Applications Manager | Application-centric monitoring, integrated infrastructure tracking, customizable dashboards, alert correlation | SQL Server, Oracle, MySQL, PostgreSQL, DB2, Sybase | From $715 per year for 5 monitors | Organizations monitoring both applications and databases, IT teams managing diverse infrastructure | Steep learning curve, requires configuration, resource intensive |
| Idera SQL Diagnostic Manager | SQL Server optimization focus, blocking and deadlock analysis, predictive alerting, performance baselines | SQL Server, Azure SQL Database | Starting at $1,995 per monitored SQL Server instance | SQL Server-heavy environments, organizations requiring deep SQL Server insights, performance optimization focus | SQL Server only, higher price point, limited cloud database support |
| Quest Foglight for Databases | Real-time analytics, adaptive alerting, cross-platform compatibility, change tracking, agentless monitoring options | Oracle, SQL Server, MySQL, PostgreSQL, DB2, cloud databases (RDS, Azure SQL, Google Cloud SQL) | Enterprise-level pricing (contact vendor) | Large enterprises, multi-vendor database environments, organizations requiring comprehensive monitoring | Enterprise pricing, complex deployment, may require dedicated resources for management |
Beyond the chart, let’s dive deeper into key considerations like cost, platform support, deployment, and scalability.
Cost Considerations
Balancing cost and performance is critical to avoid expensive downtime. Tools like SQL Server Management Studio (SSMS) are built into SQL Server, offering a no-cost option for basic monitoring. On the other hand, enterprise-grade tools like Database Performance Analyzer (DPA) and Quest Foglight demand a higher investment but deliver advanced analytics and broad compatibility. For startups or small-scale projects, newdb.io is a standout with its free tier.
Platform Support
If your environment includes multiple database types, tools like DPA, ManageEngine Applications Manager, and Quest Foglight offer the widest compatibility. For SQL Server-exclusive environments, SSMS and Idera SQL Diagnostic Manager provide tailored monitoring. Meanwhile, newdb.io focuses on SQLite-compatible databases, making it a strong option for modern apps built on libSQL and Turso.
Deployment Complexity
Ease of setup can vary widely. SSMS is integrated into SQL Server, requiring minimal effort to get started. Similarly, newdb.io prioritizes quick setup with features like instant provisioning. In contrast, enterprise tools like ManageEngine Applications Manager and Quest Foglight often require more configuration and resources, which may be a factor for organizations with limited IT capacity.
Scalability Factors
For large-scale environments managing hundreds of database instances, enterprise tools shine. Quest Foglight and DPA handle complex setups with features like machine learning and cross-platform support. newdb.io also stands out with global distribution and automatic scaling, making it an excellent choice for growing applications.
This comparison highlights the strengths and trade-offs of each tool, helping you choose the one that aligns with your specific needs and operational goals.
Conclusion
SQL database monitoring tools play a key role in addressing performance bottlenecks, preventing system crashes, and maintaining data integrity. They offer detailed insights into essential performance metrics like CPU usage, memory consumption, disk space, and query performance.
Choosing the right tool can minimize downtime, protect data integrity, simplify troubleshooting, reduce expenses, and improve user satisfaction. For U.S. businesses working with tight budgets and varying technical demands, selecting a tool that aligns with specific monitoring needs and operational priorities is essential.
Different tools cater to different business sizes and requirements. For example, budget-conscious teams using SQL Server often turn to SSMS, a free and reliable option. Small to medium-sized businesses running modern applications might prefer newdb.io, which offers a free tier with instant provisioning and global distribution.
Larger enterprises managing diverse platforms benefit from advanced tools like Database Performance Analyzer or Quest Foglight. These solutions provide extensive cross-platform support and help reduce downtime, making them ideal for more complex environments.
For growing businesses, it’s important to consider both current needs and future scalability. Solutions like newdb.io, tailored for modern app development, or ManageEngine Applications Manager, which integrates infrastructure monitoring, offer the flexibility to evolve alongside an expanding business.
FAQs
What should I consider when selecting an SQL database monitoring tool for my business?
When choosing an SQL database monitoring tool, it's crucial to consider several factors that align with your needs. Start by evaluating performance tracking features, such as monitoring CPU, memory, and disk usage. Tools that offer real-time monitoring can help you stay ahead of issues, while ease of use ensures you can quickly get up and running without a steep learning curve.
Think about your specific requirements - does the tool integrate seamlessly with your existing systems? Does it support your preferred SQL database type? These are important questions to answer before making a decision.
Your budget is another key consideration. Look for a tool that offers strong value by helping you detect and resolve issues efficiently, improve performance, and maintain database reliability. By matching the tool's features to your operational goals, you can ensure your database runs smoothly and effectively.
What’s the difference between real-time monitoring and historical trend analysis in SQL database tools?
Real-Time Monitoring vs. Historical Trend Analysis
Real-time monitoring delivers instant insights into your SQL database's performance at any given moment. It’s your go-to tool for spotting and addressing issues as they happen, helping to minimize downtime and speed up troubleshooting. For example, it can quickly flag sudden spikes in query times or unexpected system behavior, allowing you to act fast.
In contrast, historical trend analysis dives into past performance data to reveal patterns, pinpoint recurring issues, and identify long-term trends. This method is invaluable for making strategic decisions, such as planning for future capacity, optimizing resources, and preventing recurring problems. While real-time monitoring is crucial for immediate fixes, historical analysis lays the groundwork for maintaining long-term reliability and ensuring your system runs efficiently.
What are the scalability and pricing options for the SQL database monitoring tools covered in the article?
Scalability and Pricing Options for SQL Database Monitoring Tools
SQL database monitoring tools come with a range of pricing structures designed to accommodate businesses of all sizes. Options span from free open-source tools - which often require manual setup and ongoing management - to subscription-based plans tailored for growth. These paid plans usually scale their pricing based on factors like the number of users, database size, or the type of deployment.
Many tools also provide flexible deployment options, supporting on-premises, cloud, or hybrid setups. This adaptability allows businesses - from small startups to large enterprises - to choose a solution that aligns with both their budget and operational demands as their database needs evolve.